
Bitcoin falling below the realized price is a sign of reaching the bottom of the Bitcoin price and the end of its downward trend. According to CryptoSlate, determining the market price floor requires examining different sets of data.
2 reliable indicators to find the price floor of Bitcoin
Realized Price and Z-score of MVRV or “MVRV Z-score”.
The realized price is the average purchase price of existing bitcoins divided by the total number of bitcoins in circulation.
The MVRV ratio Z score also uses the ratio of Bitcoin’s market value to its realized market value. In fact, this indicator detects whether the current price of Bitcoin is higher or lower than the “fair value” or not.
Every time the spot price of Bitcoin falls below the actual trading price, the MVRV ratio falls below 1. This means that the spot trading price of Bitcoin is lower than its closing price for investors and they have suffered an unrealized loss.
The fixed MVRV ratio indicates where support is formed. Combining this ratio with the realized price indicator can signal traders when the price has reached a bottom.
In all previous bearish market cycles, we saw the price of Bitcoin fall below the realized 200-week moving average. Since 2011, Bitcoin’s price has averaged 180 days below its realized 200-week moving average per cycle. With the exception of March 2020, it took only 7 days.
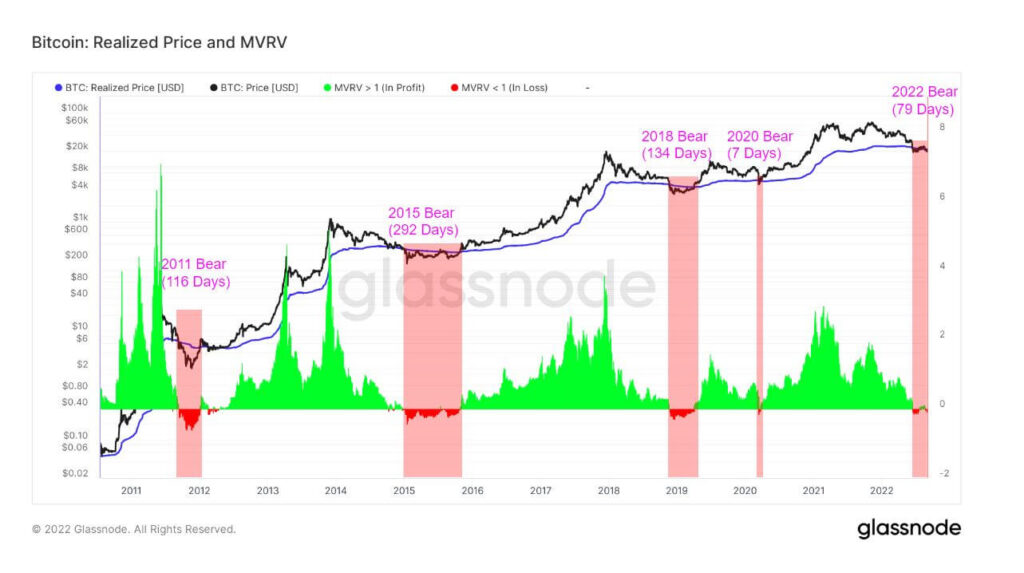
Bitcoin price remained below the realized price for 79 days as the value of Terra Network tokens began to fall in May. While the price of Bitcoin managed to climb above the MVRV ratio in the last week of August, it is too early to say that this is the end of the bear market.
Strong resistance at the $20,000 level
There is a strong resistance at the $20,000 level. This resistance ultimately shows us the strength of the market and the lowest price it can fall to in the coming down cycle.
According to data from Glassnode, Bitcoin experienced a significant jump in its unrealized relative loss in August, following a similarly sharp jump at the beginning of the summer. The relative unrealized loss index is the total dollar loss of all coins whose price at the time of purchase is greater than the current normalized (adjusted) market value. An increase in the unrealized loss score indicates that addresses are holding their bitcoins and not selling them at a loss, despite the relative decline in value.
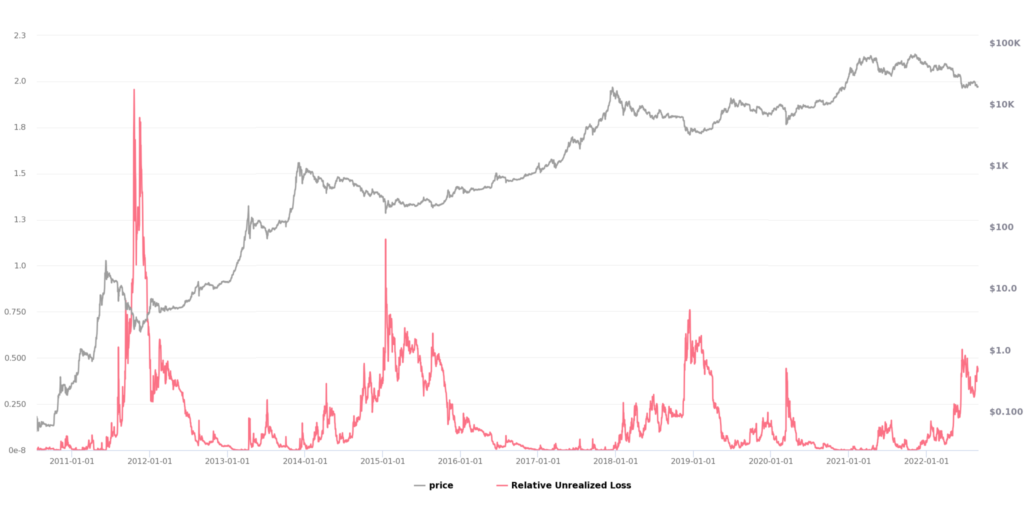
Every time Bitcoin’s relative unrealized loss increases, the digital currency registers a higher price floor. In all previous similar cycles, Bitcoin tried to retest the high it experienced before the downtrend began; But it almost always fails to achieve it. Each time, it took at least two years for the price of Bitcoin to reach the peak of its previous cycle.
A look at the data suggests that a new price floor is likely to form for Bitcoin. This price floor can be a sign of the beginning of an upward trend in the coming months, but the full recovery of the market and the start of a full-fledged upward trend will take two years.