
Bitcoin price analysis on October 12, 2022
Bitcoin has just started a new downtrend below the $19,200 level. A further break of the $19,000 support could lead to a deeper price drop.
According to BTC News, Bitcoin has been oscillating below the key levels of $20,000, $19,500 and the 100-hour simple moving average (MA 100 – red line in the image) for several days.
Bitcoin broke the support of $19,200 and started a new downward movement and the price reached 18,970. Currently, the price of the candle is hovering around $19,000.
The price is still far from $19,500 and the 100 hourly moving average. A downtrend line has formed resistance in the $19,260 range.
If the market goes up, the closest resistance in front of the price level will be $19,110. The 23.6% Fibonacci retracement level has formed a resistance in the same range. It should be noted that in this analysis, Fibonacci levels are set based on the downward movement of the price from $19,559 to the bottom of $18,970.
After $19,110, it is the turn of the $19,260 resistance of the downward trend line on the chart and the 50% Fibonacci retracement level. A break through this resistance will pave the way for Bitcoin to jump to $19,500 and the 100-hour simple moving average.
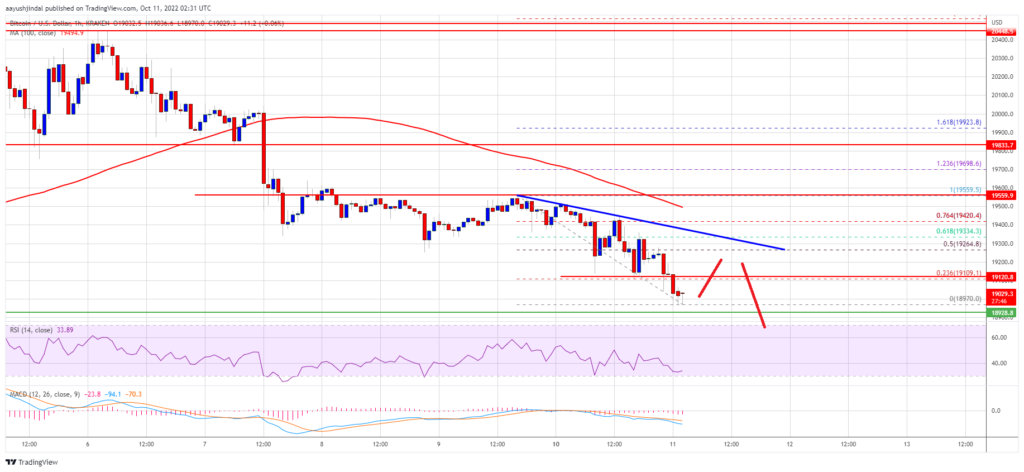
Bitcoin price chart
A continuation of the uptrend could push Bitcoin up to $19,600, after which there will be an opportunity for the price to jump to $20,000.
If Bitcoin continues to fail to break through the $19,260 resistance, the downtrend from earlier today will continue. In this case, the closest support ahead of the price will be the $19,000 level.
The next key support is $18,920, and a break of this level could lead to Bitcoin falling to the $18,500 support.
The MACD index is accelerating in the bearish range. The relative strength index (RSI) is also below the middle axis at the level of 50.
As mentioned, $19,000 and $18,500 are key supports for Bitcoin. The prices of 19,260, 19,500 and 20,000 dollars also act as resistances.